Price: 93.84
S/L: 94.96
1st Trailing Stop: 92.76
Gain: 108 pips
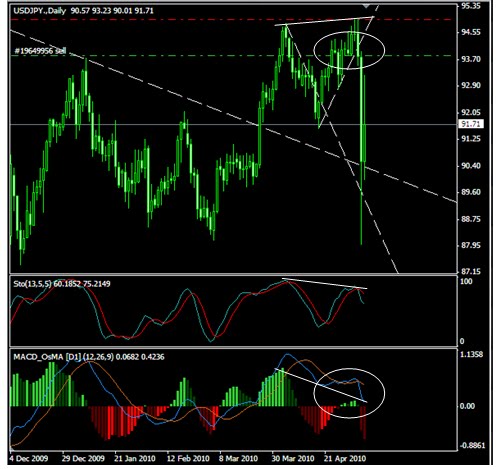
USDJPY chart show the divergence in price action (Double tops) and presented indicators giving possible sell signal. Looking closer in 4H timeframe, look for the break out to enter the short position around 93.84. In smaller timeframe, MACD histogram showed continuously declines indicated the weaker power of the bull rally. The stop loss place at the top of previous high.
Exit: Hit stop loss at 92.76 after the big dip down to 88.00.

No comments:
Post a Comment