Price: 1.27001
Stoploss: 1.25838
1st Trailing Stop: 1.26383
Around 1.25800-1.2600 showed strong support from both Fibo fan and retrace. Also, the break of downtrend line suggest buying opportunity.


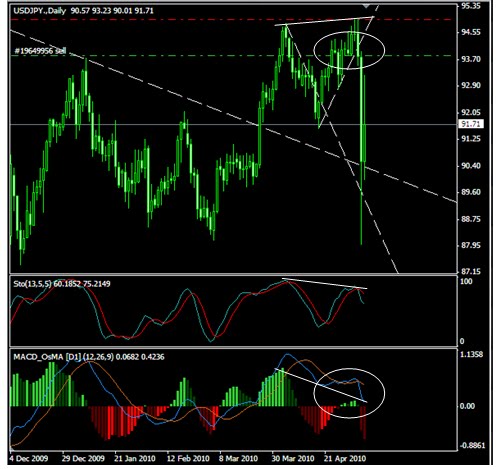
At daily chart stochastic is showing potential reversal as well as histogram in MACD. Though these two indicators alone give many false signals, I believe there should be a rebound after the large dip showing in both charts. As Europeans loan plan is approved over the weekend, we can see gap open breaking the downtrend line in 1H timeframe. Buy here and see where market will act.
Exit: got stopped out at S/L level, 1.2672 lose 208 pips.
Learning: Should have wait for gap closing and confirm MACD histogram in 4H chart first to enter the trade.


2nd adjusted trailing stop: 1.4764
Gain: 469 pips
GBPUSD in daily chart is in the bearish sentiment as MACD lines are crossed about a week. Continuous downtrend is expected. Hence, look for the sell signal to go with the flow. Stop is placed at previous top.
Exit: Stopped out at 1.4764. Using previous pull back top in downtrend as trail stop, gain 469 pips


In daily chart, gold spot showed divergence between price action and MACD histogram as well as Stochastic giving us the sell signal. We look for the potential break out in the 1H time frame to confirm the end of uptrend. Stop loss is set at the previous top.
Exit: we got stopped out at trailing stop level at 1177.45 with 13 pips gain. After hit stop level gold spot make the new high at 1210 in the following day.

